Details Check List
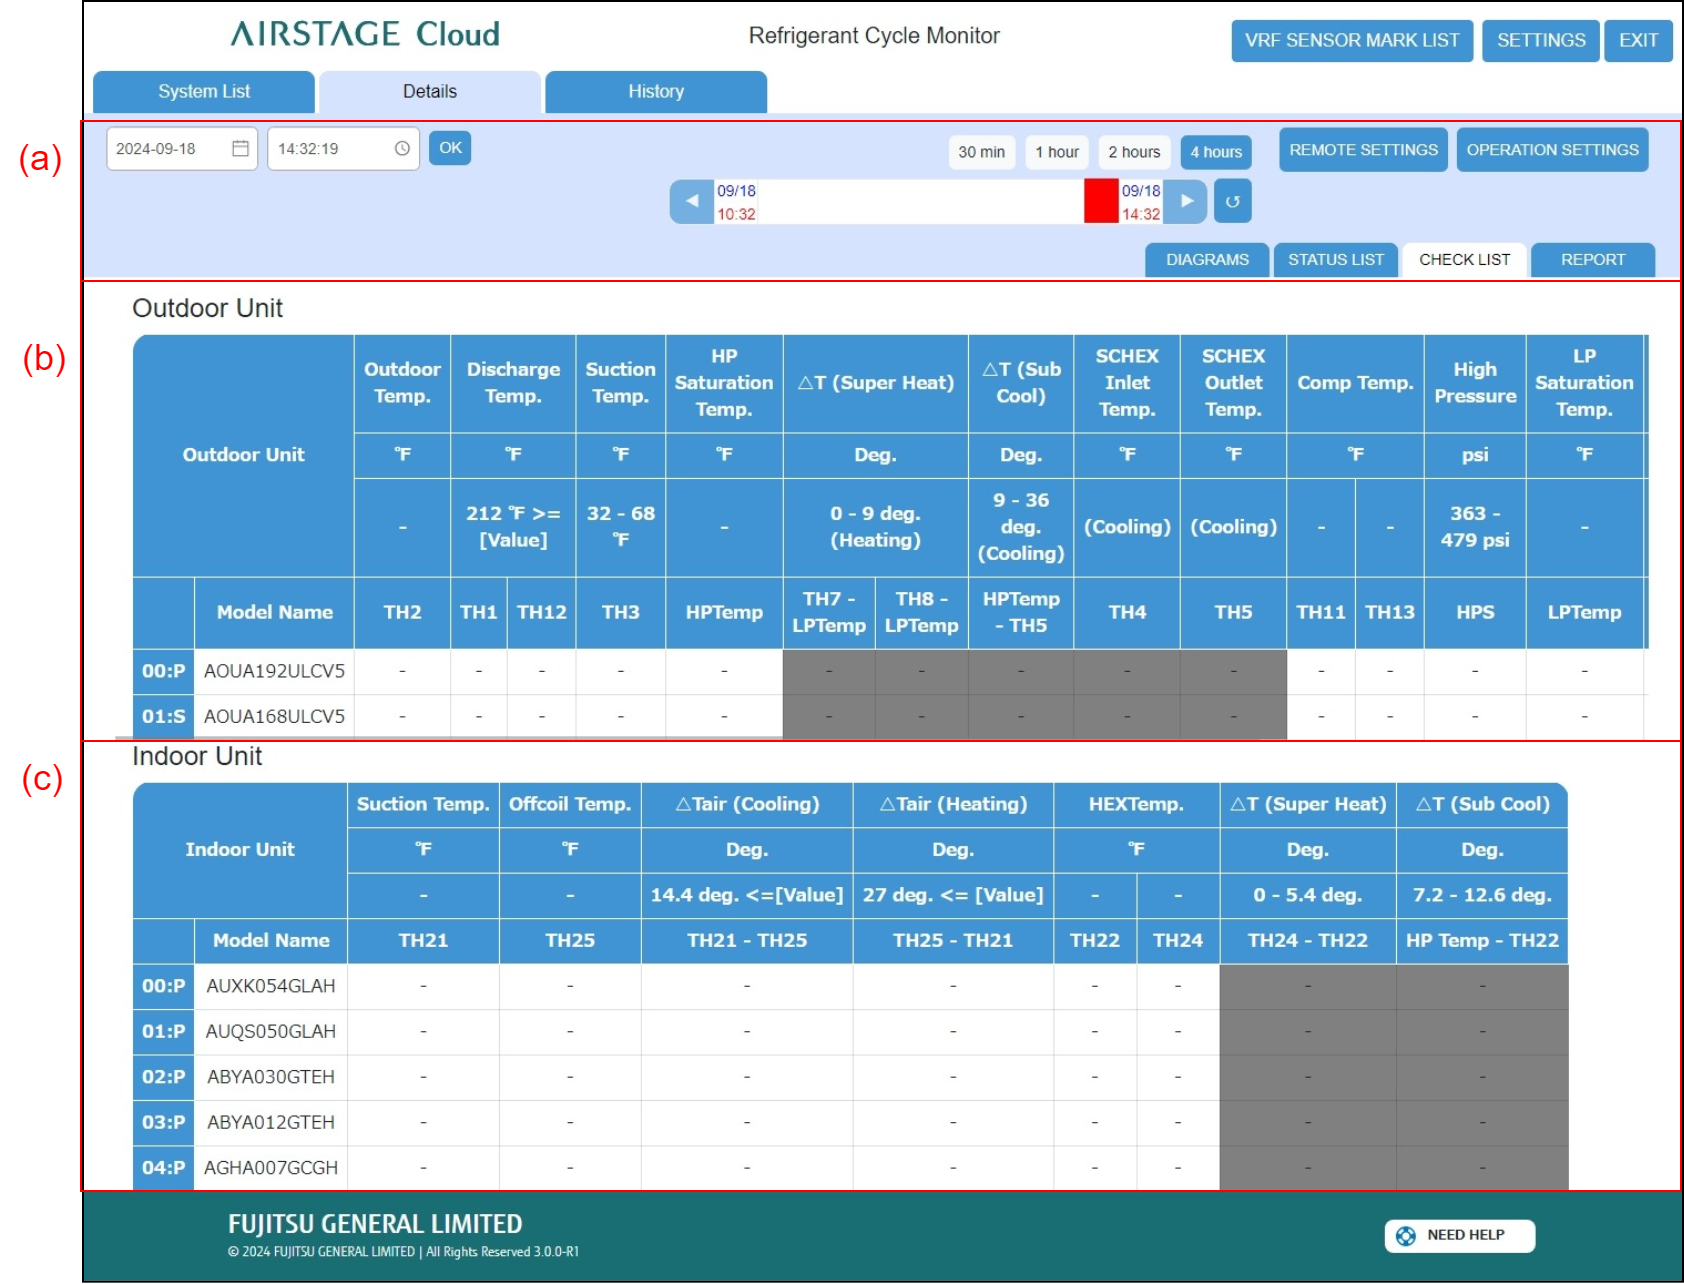
The Details Check List screen can be displayed by tapping [CHECK LIST] tab at the Control area.
Each check item is calculated by the sensor value inside the outdoor unit or indoor unit and the results are judged whether they are normal or not.

(a) Control area
(b) Outdoor Unit Check list area
(c) Indoor Unit Check list area
Control area

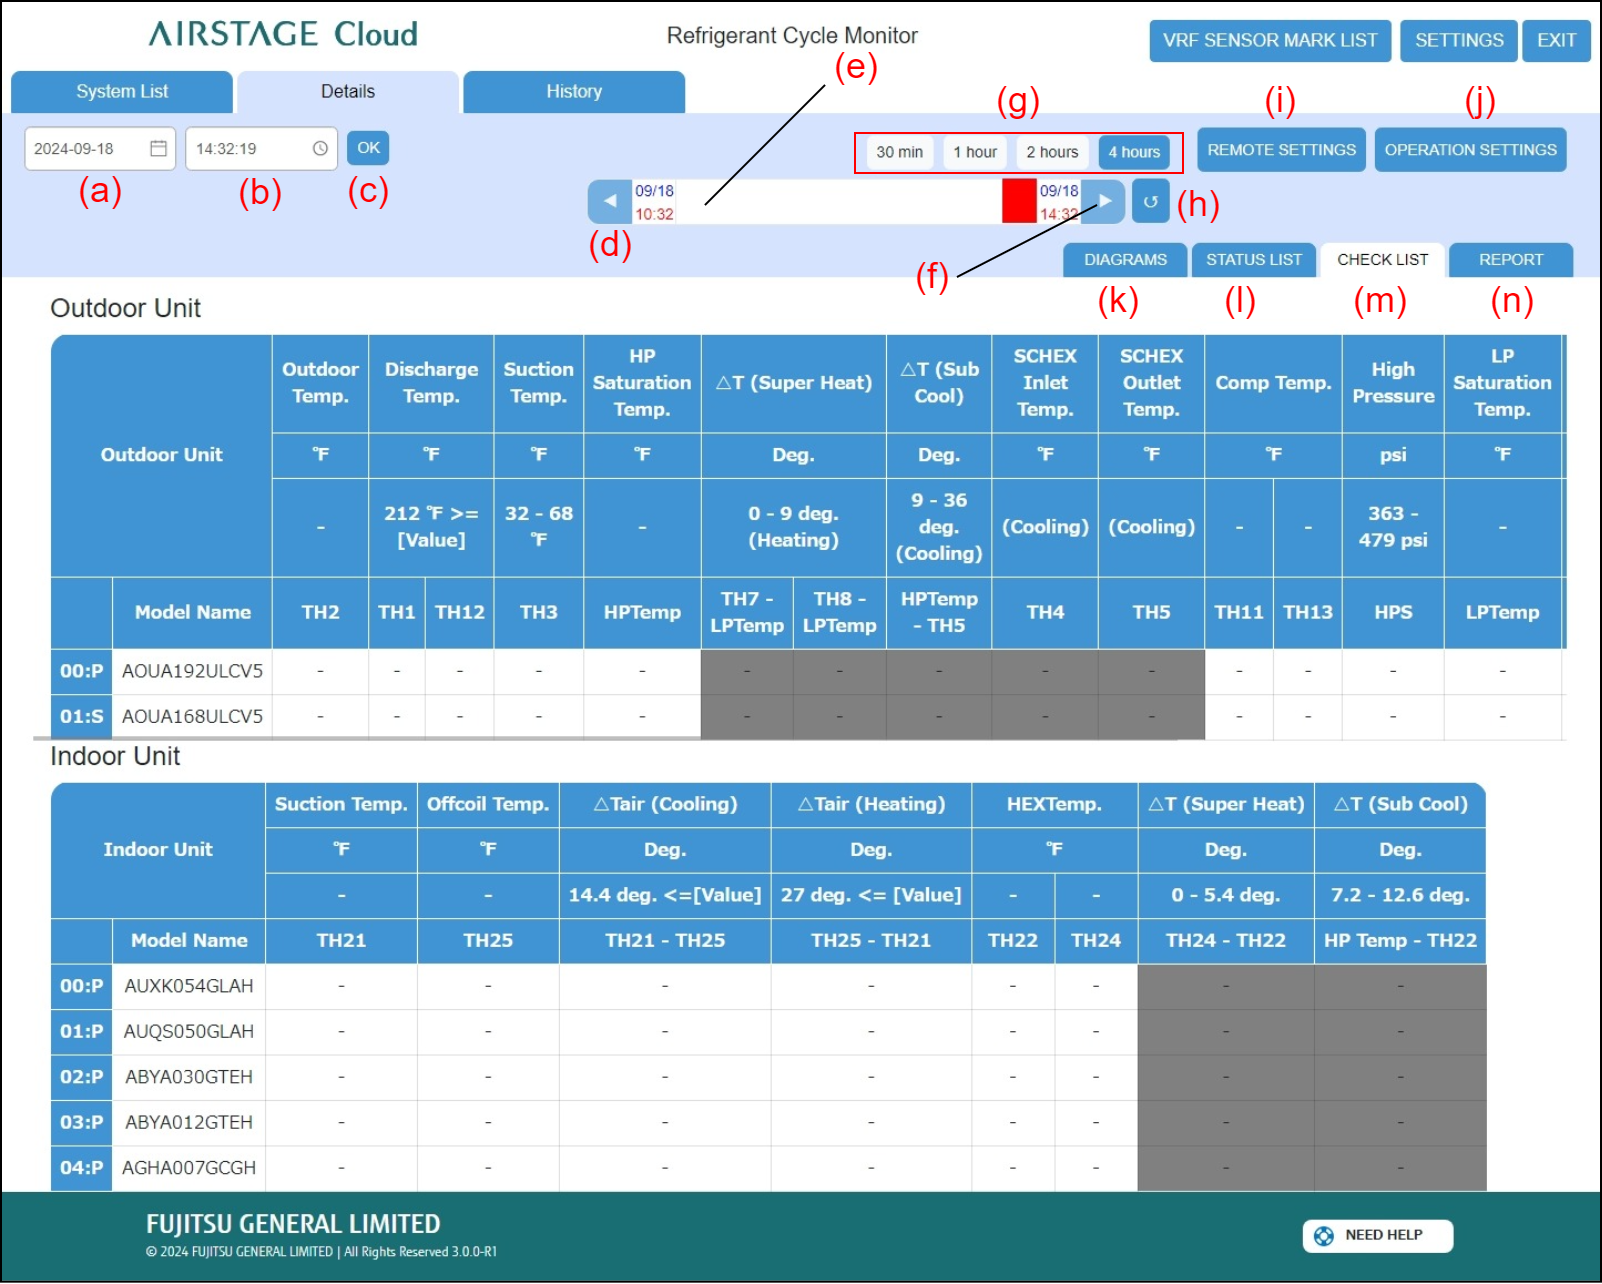
(a) Date setting field
Sets the date of data you want to display at the Details Check List screen.
(b) Time setting field
Sets the time of data you want to display at the Details Check List screen.
(c) [OK] button
Confirms the date and time set at (a) and (b) and updates the screen.
(d) [![]() ] button
] button
Sets the time displayed on the gauge before the time currently displayed.
(e) 4 hours gauge
Sets the time displayed on the Check List. The time range that can be displayed on the gauge is set by (g) button.
The date and time are set by moving the probe using the drag and drop of mouse.
(f) [![]() ] button
] button
Advances the time displayed on the gauge ahead of the time currently displayed.
(g) [Gauge Time Selection] button
Specifies the X-axis scale (30 min / 1 hour / 2 hours / 4 hours) of the graph.
(h) [![]() ] (Auto Refresh) button
] (Auto Refresh) button
Updates the screen to the latest data.
[![]() ] (Blue): Updates the screen to the latest data automatically.
] (Blue): Updates the screen to the latest data automatically.
[![]() ] (Gray): Does not update the screen automatically.
] (Gray): Does not update the screen automatically.
(i) [REMOTE SETTINGS] button
Displays the “Remote Settings” modal. For details, refer to “Remote Function Setting”.
(j) [OPERATION SETTINGS] button
Operates the indoor units for RC group. Tap the [Send] button after operation.
(k) [DIAGRAMS] tab
Displays the Details Diagrams screen.
(l) [STATUS LIST] tab
Displays the Details Status List screen.
(m) [CHECK LIST] tab
Displays the Details Check List screen.
(n) [REPORT] tab
Displays the Details Report screen.
Outdoor Unit check list area / Indoor Unit check list area
The sensor value calculated in the condition set at Control area is displayed for each outdoor / indoor unit. The judgment results are also displayed. If the calculated sensor value is deviated from the normal value, the background of the data cell becomes red.
For each sensor information, tap the [VRF SENSOR MARK LIST] button.