 GLOBAL | English
Sales and Profit
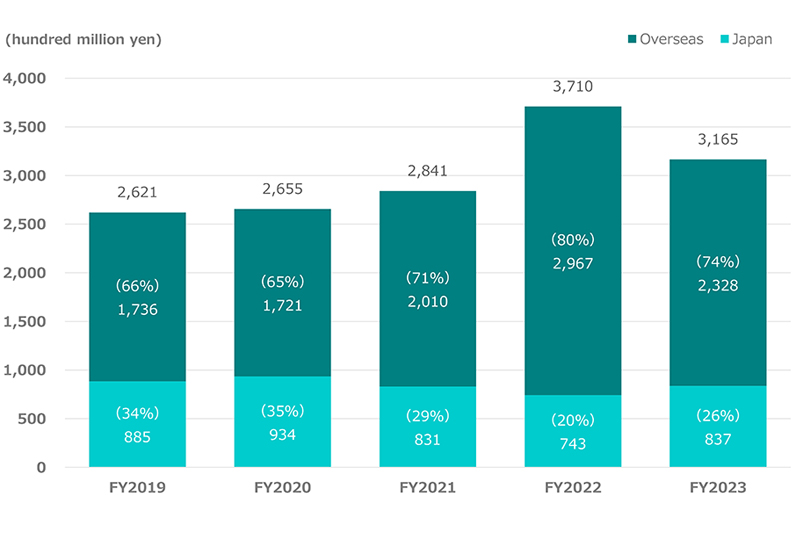
Sales
| Accounting term | FY2019 | FY2020 | FY2021 | FY2022 | FY2023 |
|---|---|---|---|---|---|
| Japan(hundred million yen) |
885
(34%) |
934
(35%) |
831
(29%) |
743
(20%) |
837
(26%) |
| Overseas(hundred million yen) |
1,736
(66%) |
1,721
(65%) |
2,010
(71%) |
2,967
(80%) |
2,328
(74%) |
| Total(hundred million yen) | 2,621 | 2,655 | 2,841 | 3,710 | 3,165 |
scroll
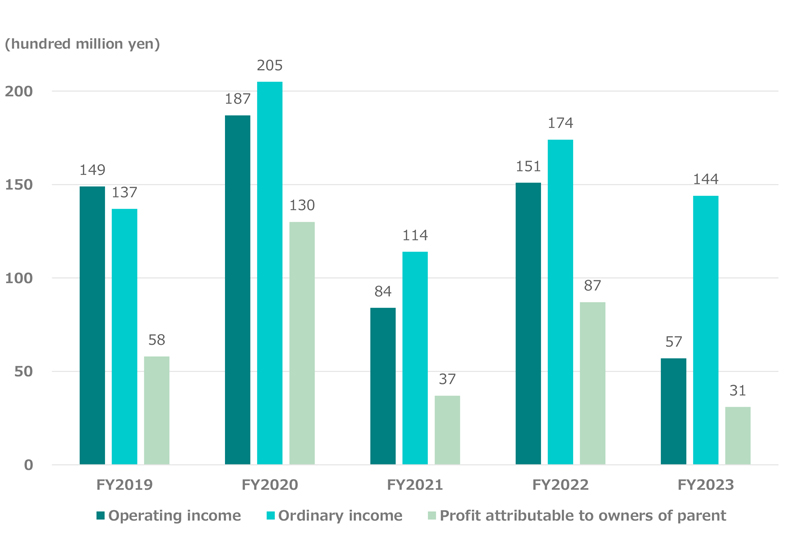
Operating income / Ordinary income / Profit attributable to owners of parent
| Accounting term | FY2019 | FY2020 | FY2021 | FY2022 | FY2023 |
|---|---|---|---|---|---|
| Operating income (hundred million yen) | 149 | 187 | 84 | 151 | 57 |
| Ordinary income (hundred million yen) | 137 | 205 | 114 | 174 | 144 |
| Profit attributable to owners of parent (hundred million yen) | 58 | 130 | 37 | 87 | 31 |
scroll
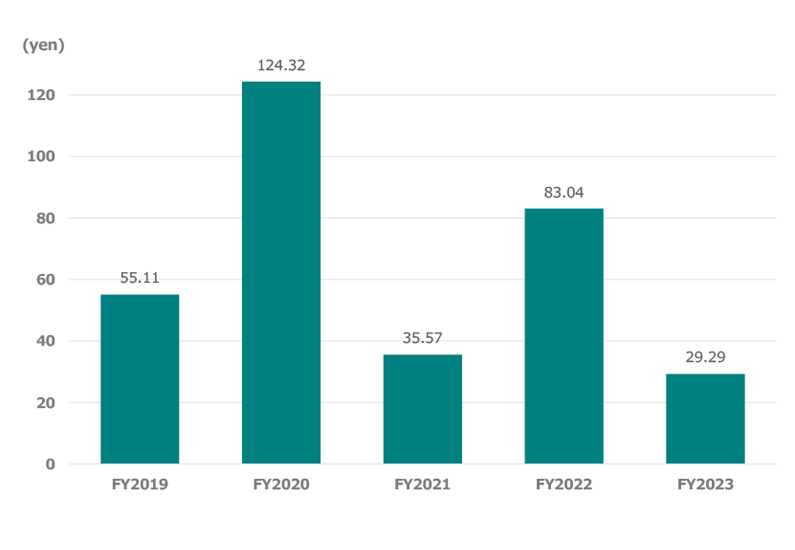
Earnings per share (EPS)
| Accounting term | FY2019 | FY2020 | FY2021 | FY2022 | FY2023 |
|---|---|---|---|---|---|
| Earnings per share (EPS)(yen) | 55.11 | 124.32 | 35.57 | 83.04 | 29.29 |
scroll